[Back to TullyRunners Home Page]
|
TullyRunners.com - Article |
Saratoga Girls & Other NY Girls XC Teams ... How Good are They?
by Bill Meylan
...
|
|
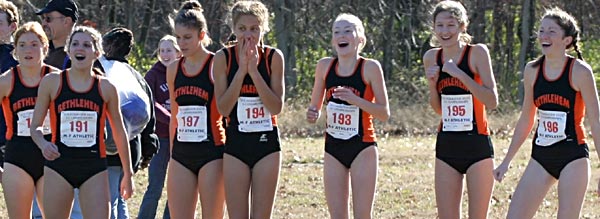
| A Happy Bethlehem Team at the start-line of the 2003 NY Federation Championships ... Bethlehem finished 3rd (behind Saratoga and Argyle) ... they were ranked 7th best team in the Northeast Region of the USA ... from left to right are Roxanne Wegman (Jr), Emily Malinowski (Jr), Ashley Dwyer?? (Sr), Taylor Jackson (Jr), Kristin Kenney (8th grade), Carly Magin?? (So) and Claire Luke?? (So) |
| This article illustrates the relationship between
team strength and "team average times" in cross country (see
related article on team average times)
... The Saratoga girls were the number one rated team in the
nation last year (The Harrier
Magazine), and will likely remain on top during the 2004 season ...
By comparing team average times, we can compare Saratoga's strength to other teams, and in the process, demonstrate the relative
strength of other teams. For starters, here's an example of Saratoga's team strength ... The Footlocker Northeast Regional brings together the best individual runners in the northeastern USA ... the Saratoga team members competed individually, and both Nicole Blood and Lindsey Ferguson qualified for Footlocker Finals ... if the top five Saratoga runners at the Footlocker NE were scored using average time versus the top five (non-Saratoga) runners, the results would be: 1 Blood, Nicole 10 GANSEVOORT NY 17:44.7 Avg = 18:52.1 4 Ferguson, Lindsey 10 GREENFIELD CTR NY 18:23.9 20 Solomon, Ruby 11 SARATOGA SPRINGS NY 19:05.0 28 Vahanian, Cameron 10 GANSEVOORT NY 19:21.5 50 Delay, Karyn 11 SARATOGA SPRINGS NY 19:45.2 2 Sedberry, Brittany 10 Beesley's Point NJ 18:16.4 Avg = 18:22.7 3 Ryan, Aislinn 10 BELLVALE NY 18:21.0 5 Koons, Frances 12 Allentown PA 18:24.7 6 Donaldson, Lindsay 12 LINCOLN MA 18:25.4 7 Clausen, Jennifer 10 JACKSON NJ 18:26.1 Therefore, only 29.4 seconds (of average time) separates Saratoga from the next best five runners in the entire northeast ... That's pretty remarkable! ... and none of the Saratoga team graduates ... And without exaggerating, that 29.4 second difference could diminish to 20 or 15 seconds in 2004 ... So Saratoga is really a benchmark for the rest of the country. The table below lists the team average times of Saratoga at seven meets in 2003, along with average times of top NY teams (Argyle, Bethlehem, Bay Shore, Warwick, Columbia and Shenendehowa) and several nationally ranked teams outside NY ... (Columbia and Shenendehowa are included because they are in the Suburban Council conference with Saratoga and Bethlehem) ... most average times in the table are the result of head-to-head competition, but a few were separate races on the same course, same day (such as Argyle was in the Class D race at States while Saratoga was in the Class A race) ... the lower part of the table lists the corresponding average time differences between Saratoga and the other teams.
|
|
Team Average XC Times in 2003 - Comparing Saratoga & Other Top Teams |
                    Great     Manhattan  Brown Univ  Suburban   Section 2  NY States    NY
                   American    Invite      Invite    Council     Class Mt  Class Mt    Feds

Saratoga            18:59.0    14:57.5     17:47.1    17:48.7    17:47.0    19:08.3    18:44.1

Argyle              19:22.1    15:14.4     -------    -------    18:07.8    20:03.0    19:18.0

Bethlehem           -------    -------     -------    18:38.0    18:39.0    -------    19:51.1

Bay Shore           19:38.0    15:30.9     18:50.2    -------    -------    20:06.8    19:59.7

Warwick             20:03.5    15:55.2     -------    -------    -------    20:25.0    19:59.7

Columbia            20:47.2    16:02.6     19:08.0    18:47.9    18:55.0    -------    20:37.4

Shenendehowa        20:47.5    16:17.0     -------    19:06.4    18:59.0    -------    20:27.3

Nationally Ranked:
Amherst Reg MA      20:11.3    -------     18:59.4    -------    -------    -------    -------
Cedar Park TX       19:47.0    -------     -------    -------    -------    -------    -------
Mountain View UT    20:04.3**  -------     -------    -------    -------    -------    -------

 ** actual Mountain View average was 20:36, but Heidi Magill did not run ...
    this estimate assumes she did run (at her Utah State meet level)

 --- Sites of races:  Great American (Cary, NC), Manhattan (Van Cortlandt Park 2.5 mile,
         Brown Univ (Rhode Island), Suburban Council & Section 2 Mt (Saratoga Park),
         NY State Class Mt (Marcus Whitman HS), NY Feds (Bowdoin Park)


           Time Differences (in seconds) Between Saratoga and the Other Teams

                    Great     Manhattan  Brown Univ  Suburban   Section 2  NY States    NY
                   American    Invite      Invite    Council     Class Mt  Class Mt    Feds

Saratoga             00.0       00.0        00.0       00.0        00.0       00.0      00.0

Argyle               23.1       16.9        ----       ----        20.8       54.7      33.9

Bethlehem            ----       ----        ----       49.3        52.0       ----      67.0

Bay Shore            39.0       33.4        63.1       ----        ----       58.5      75.6

Warwick              64.5       57.7        ----       ----        ----       76.7      75.6

Columbia            108.2       65.1        80.9       59.2        68.0       ----     113.3

Shenendehowa        108.5       79.5        ----       77.7        72.0       ----     103.2

Nationally Ranked:
Amherst Reg MA       72.3       ----        72.3       ----        ----       ----      ----
Cedar Park TX        48.0       ----        ----       ----        ----       ----      ----
Mountain View UT     65.3       ----        ----       ----        ----       ----      ----
|
| One important aspect of average time is "who the
five runners were" ... the top five runners for each team are not
necessarily the same from race to race ... For example, look at the time
differences for Bay Shore -- after the Manhattan Invite, their time
differences increased significantly -- it coincided with the absence
of Mary Liz McCurdy (who stopped racing due to injury) ..... Also in the
table, I made an approximation for the nationally-ranked Mountain View
Utah team at the Great American (Race of Champions) - top runner Heidi
Magill did not run, but if she did run (comparable to her Utah State
Meet performance) the Mountain View team average time would fall by
nearly 32 seconds. Concept of Time Differences ... Consider a track leaderboard with the runners ranked but no times shown -- you would have no idea of how good one runner is relative to another ... the times and the time differences between runners give some idea of relative ability (it's not perfect, but it's very useful) ... for example, a time difference of 30 seconds in the mile would indicate one runner is significantly faster than another, while a time difference of only a few seconds (plus or minus) for a group of runners would suggest a close competitive race. Many XC coaches rate their own runners by how close they finish to each other ... many also rate other teams by the same method (the time differences between their runners and the other team's runners) ... Time difference is the driving force behind my speed ratings which depict how fast individual runners are running compared to each other ... when you know how fast the individuals are running, you can make a reasonable extension to the team. The nice thing about the table above is that absolute times (the actual race times) don't require any adjustment for courses or distances because it's primarily head-to-head racing (the best way to compare teams) ... and what we are really looking at is the time difference between teams ... personally, I record the time differences between individuals and then extend it to the team when required -- by this method, I don't need to know the name of the course or the exact distance, just the names of the runners and their times .... And if a time adjustment is necessary for a course, if sufficient data are in my databases, I can make a very reasonable statistical approximation of the relative speed of any course on a particular day compared to any other course ... Time differences make it possible.
Considerations to note in the table above ...
Comparative Team Ranking The final 2003 national and regional team rankings by Marc Bloom are available from the Harrier web-site and Harrier magazine ... The final Northeast regional ranking has Saratoga #1, Argyle #2, Bethlehem #7, Warwick Valley #8, and Bay Shore #10 ... The relative ranking order of these NY teams is exactly the same as their finishing order at the NY Federation Championships ... This is noteworthy because Bay Shore beat Warwick 3 out of 4 races (head-to-head, and twice in prominent "inter-state" races (Great American ROC, Manhattan Invite)), and at Feds, their average times were identical and Warwick beat Bay Shore by only one point in the team score (Bay Shore did have Mary Liz McCurdy in the two inter-state races) ... Apparently, all teams should take note of the importance of state championship meet results. Nationally, Saratoga was ranked #1 and Argyle ranked #9 -- no other NY team was ranked in the top 25 ... Now the comparative strength of the NY teams is known (the average time table above is good indication) ... they raced each other multiply times in top competitions and we know the results. So how do the NY teams compare to teams outside NY?? ... For starters, Saratoga, Argyle, Bay Shore and Warwick finished 1st, 2nd, 3rd and 6th, respectively, at the Great American Race of Champions ... in head-to-head competition, they all beat Amherst Regional MA (ranked #3 in the northeast and 19th nationally) and Mountain View UT (ranked 20th nationally) with Cedar Park TX (ranked #18 nationally) finishing 4th behind Saratoga, Argyle and Bay Shore ... At the Brown University Invitational, Saratoga and Bay Shore beat Amherst Regional MA again, and this time, Bay Shore beat them without Mary Liz McCurdy ... the average time difference between Saratoga and Amherst was exactly the same as at the Great American (which helps confirm the difference in team strengths). So how does Amherst MA get ranked ahead Bay Shore & Bethlehem? ... To Amherst's credit, they race very well at the Massachusetts State Meet - they won their divisional race with an average time (19:59.8 at Northfield Mt course) 62 seconds better than the next team ... while this was an improved performance, it only approximates the team strength of Bay Shore (without Mary Liz McCurdy) ... But again, the important ranking factor seems to be performance at the State meet. Two New Jersey teams (Shawnee and Voorhees) are ranked ahead of Bethlehem, Warwick and Bay Shore in the Northeast rankings ... Shawnee and Voorhees ran 1st & 2nd at the NJ Meet of Champions (with average times of 20:11.8 and 20:18.2) ... at the Ridgewood Invitational (about a month prior to the NJ meet), Warwick beat Voorhees by a score of 55 to 81 -- Warwick's Aislinn Ryan did not run and neither did a top Voorhees runner, but it still shows some relative team strength ... So how do average times of 20:11.8 and 20:18.2 at Holmdel relate to the NY teams?? ... according to a Nike Team National article on DyeStat, "there is a time difference of about 3:20 between performances at Van Cortlandt and those at New Jersey's Holmdel Park" ... therefore, the Holmdel times would convert to 16:51.8 and 16:58.2 for Van Cortlandt's 2.5-mile course (but for girls, and the relative speed of VCP in 2003, I would subtract at least another 20 seconds) -- in any case, the New York teams are significantly faster ... A better comparison might be the team average times from the NY Feds (Bowdoin Park) and NJ MOC (Holmdel Park), Bethlehem (19:51.1), Warwick and Bay Shore (19:59.7) ... for either NJ team to be faster than Bethlehem, Holmdel Park would need to be at least 21 seconds (or more) slower than Bowdoin Park, and it is not (it's normally a little faster). NY Advocate ... If I sound like a cheerleader for girls XC in NY State, that's OK ... in 2003, and in the upcoming 2004 season, the quality of individual girls and girl teams in NY is outstanding! ... I don't think I'm biased, I'm just a guy who looks at statistics and results. Final Note ... Is anybody in the nation even close to Saratoga? ... Smoky Hills CO had a really good team in 2003 (ranked #2 in the nation) ... like Saratoga, two Smoky Hill runners qualified for Footlocker Nationals, and Katelyn Kaltenbach won Footlockers ... overall, their team average time is only about 10 seconds behind Saratoga, but as noted earlier, Saratoga will likely improve this year. Nike Team Nationals (NTN) ... I think the Nike Team Nationals is a great idea and I have positive impressions from everything I've read about it ... My one concern - I hope it doesn't distract too much from the Footlocker Finals which is a very special event for high school cross country ... The Nike Team National concept of eight regions in the nation seems to be a good idea for the first year ... because logistics and timing do not allow regional qualifying meets, NTN must take the form of "by invitation only" ... and since it's promoted as a "national" meet, NTN must invite teams from all over the country ... the 20 team limit could be raised a little (but then, I'm not paying for it). The choice of Portland Meadows racetrack is wonderful ... I like it, but I'm a horse racing fan (my brother owns and helps train a stable of race horses in central NY ... so guess where my speed rating research began a long time ago).
I do not envy Marc Bloom and the other NTN
rankers ... they will get criticized no matter what they do ... I'm
confident they will invite any team capable of winning, and that's the
first priority ... And remember - NTN is an invitational race, and they
can invite whoever they want (it's their party) ... People have different ideas of how
teams should be ranked, but I trust the NTN ranking system will be as fair
as possible ... and I'm fairly certain there will be a lot of infighting
amongst rankers ... they can take a hint from the NY sectional
coordinators who occasional decide that "arm-wrestling" and
"pistols-at-twenty paces" are the best methods of picking the 16 public
school teams that get into the NY Federation Meet
|